The Sandy/Nor’ easter hybrid superstorm set to impact the Eastern Seaboard this weekend into early next week has officially been dubbed “Frankenstorm”. I would assume it as a halloween joke but this storm is not joking around. Power outages could top 10 million customers if the underground power plants for NYC are flooded. Even though this sounds far fetched, it is really not. The NHC (National Hurricane Center) has Sandy Moving onshore in Delaware.

The 2PM track from the hurricane center has Sandy moving onshore in DE as a hurricane.
This would push a 7-11 foot storm tide into NYC. The city has 5 foot flood walls that would easily be overtopped and flooding lower Manhattan and the financial district. The water would rush into the subway system shorting out the electric 3rd rails. Also this surge would rush through the intricate tunnel system making for a huge mess. The power plants are located in these tunnel systems and would be shut down on purpose in anticipation for the storm or, they would get knocked out of service by the surge flooding.
This is supported by few models however and is only there for the European model (ECMWF) which predicts a DC landfall. This is the number one performer among models. There are several less reliable models that like this scenario as well. The second best performer has Sandy making a direct hit on NYC Sunday evening.

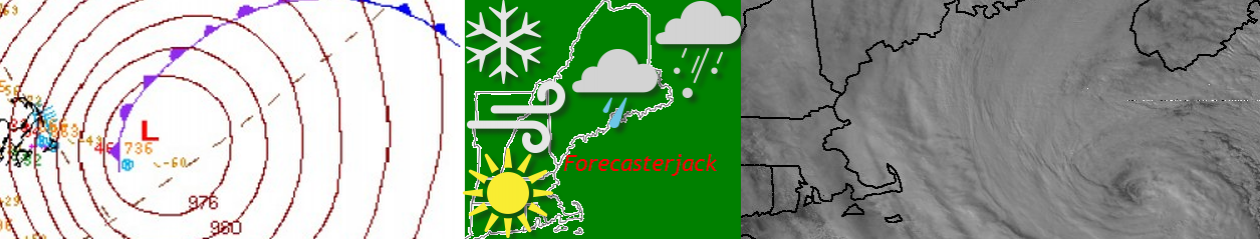
The black and purple swath is the Frankenstorm Nor’easter hitting NYC as shown by the American GFS model.
This is a very reasonable scenario for a few reasons. 1) There is a low pressure system located in the Central Atlantic Ocean now and this will act to pull Sandy towards the sea. 2) There is a trough of low pressure moving in from the west as well.

Radar Imagery from 2:50 PM today of the colds front and trough moving in from the west.
This trough will act to pull in Sandy from the SE hitting the NYC area. The max surge would be 15 feet. The trough will also give Sandy a boost of energy which will allow the storm to “bomb out” or undergo cyclogenisis (the rapid deepening or strengthening of a low). The trough will then pull Sandy to the north through western MA and VT.
The cold front and trough will act to create the heaviest October rains ever recorded by taking moisture saturated air and slamming it into cold Canadian air which will mass condense it. The result? Up to 15″of rain for some areas.

The HPC (Hydrometerological Prediction Center) forecast for rainfall. This is in connection with the NHC track so these 15″+ amounts might stretch farther north into NJ and NY. Also, this is only to Wednesday, it will be raining all the way through Thursday for parts of Northern New England.
Speaking of cold air… there will be a snowy side to this system. The storm is very lopsided due to shear, and that will cause the storm to spin energy way to the NW of the center where the cold pocket aloft is. This cold pocket will help to create snow for Pennsylvania and any mountains north of NYC.

As you can see, there is no hurricane like anything in this inferred satellite image.
Instead is a mass of clouds that stretch all the way from the Caribbean Sea to the Del-Marva Peninsula. The east side has the most activity so even if the storm hits NYC, New England will feel harsh impacts. Although the east side is larger, the storm will grow substantially by the time of landfall and will be able to push activity well to the NW of the center.
-Jack