Atlantic disturbances upgraded, looking better

Our 2 disturbances in the tropical Atlantic have received invest status last night and this morning which opens up mountains of new information about them. I’ll dig through it and do my best to explain it below.

By the numbers:
2 invests (97L and 96L)
1 TS (KIKO)

2 day probability of formation into TD/5 day probability of formation into a TD

97L- NHC 10/10
ME 20/40

96L- NHC 30/30
ME 10/10

KIKO- 60 mph, 1000mb

More details on all systems below.

TWO 8-31-13 EPAC

Atlantic Tropical weather outlook (TWO)

TWO 8-31-13

Eastern Pacific Tropical weather outlook (TWO)

—————————————————————————————————-

I’ll start with the one closest to the Caribbean Islands designated 97L by the NHC this morning.

97L5

Mid afternoon satellite image of 97L.

The forecast for 97L…  Now that this system is an invest, the specially designed hurricane models can weigh in on the forecast. The 2 images below show the intensity forecast and the track forecast from the models.

97L

The intensity forecast from the hurricane models for 97L.

The shaded patches are the different classifications. The bottom white swath is tropical depression status while the middle grey swath is tropical storm status and the uppermost white swath is CAT 1 hurricane status. Read more about tropical cyclone classification here. Read more about hurricane models here.

97L2

This map shows the hurricane models depiction of the storms track.
NOTE: these are just model depictions and are not official forecasts.

Intensity: The models and I are in unanimous agreement that this storm will likely reach tropical storm intensity at some point. Where we differ, is when. I expect the storm to lose a large part of its convection during the diurnal minimum, the time of day where there is the sun’s energy is at its weakest point during the day.Read more about this phenomenon here.

However, DMAX will greet the system bright and early tomorrow morning and will allow for significant return of convection to the system. There is a modest amount of spin associated with this system and with a bit more convection (may happen tomorrow or Labor Day), it could reach TD status. However, there are a few factors suppressing development and one of those is shear.

97L8

This map indicated wind shear in the yellow contours and the upper air wind direction in the tan-ish lines and arrows. Notice the clockwise rotation shown by those arrows over 97L. That is an upper air anticyclone or high pressure. This helps act as a shear force-field and it also shows signs of a healthy upper outflow pattern.

97L6

This graphic shows some of the things that 97L needs to work on. Lets start at the top left. This box indicates an outflow cloud-for lack of better word- which forms when thunderstorms collapse inward and generate a massive burst of wind known as a mirco or macro burst depending on the scale. This sudden release of energy containing cool air from aloft spreads along the surface there warm, moist air resides. The clash of warm and cool creates a cloud.

These clouds signal an unhealthy storm by indicating thunderstorms inside it are dying which decreases its capability to harness the latent heat energy that it depends on. Think of it like a wind turbine suddenly losing its capability to harness the wind energy. Same concept.

The upper right square shows the lack of healthy upper air outflow in 3/4 quadrants of the system. This must also be resolved before it can become a healthy storm. The upper air outflow is a phenomenon that whisks away cool, dry air from the center of the storm to the fringes of the system making more room for warm moist air to take its place.

hurricane

Here is a little graphic to show outflow in a hurricane.

The bottom 2 squares are the same thing in different colors. They are microwave imagery that capture the location and intensity of the strongest thunderstorms in a system like this. Notice there are very few bright red dots indicating an absence of strong thunderstorms and therefore, the absence of a functioning storm.

97L7

This graphic shows the 3 main features of 97L. The APPROXIMATE center, the strongest thunderstorms and what outflow channel it has. All 3 areas must improve greatly before TD status can be attained.

Track- This all depends on intensity. As discussed in yesterday’s post, if a storm is strong enough, then it will be more capable of being tugged north by a trough in the upper levels of the atmosphere. This is what will have the most effect on track.

CaribbeanMapLarge (2)

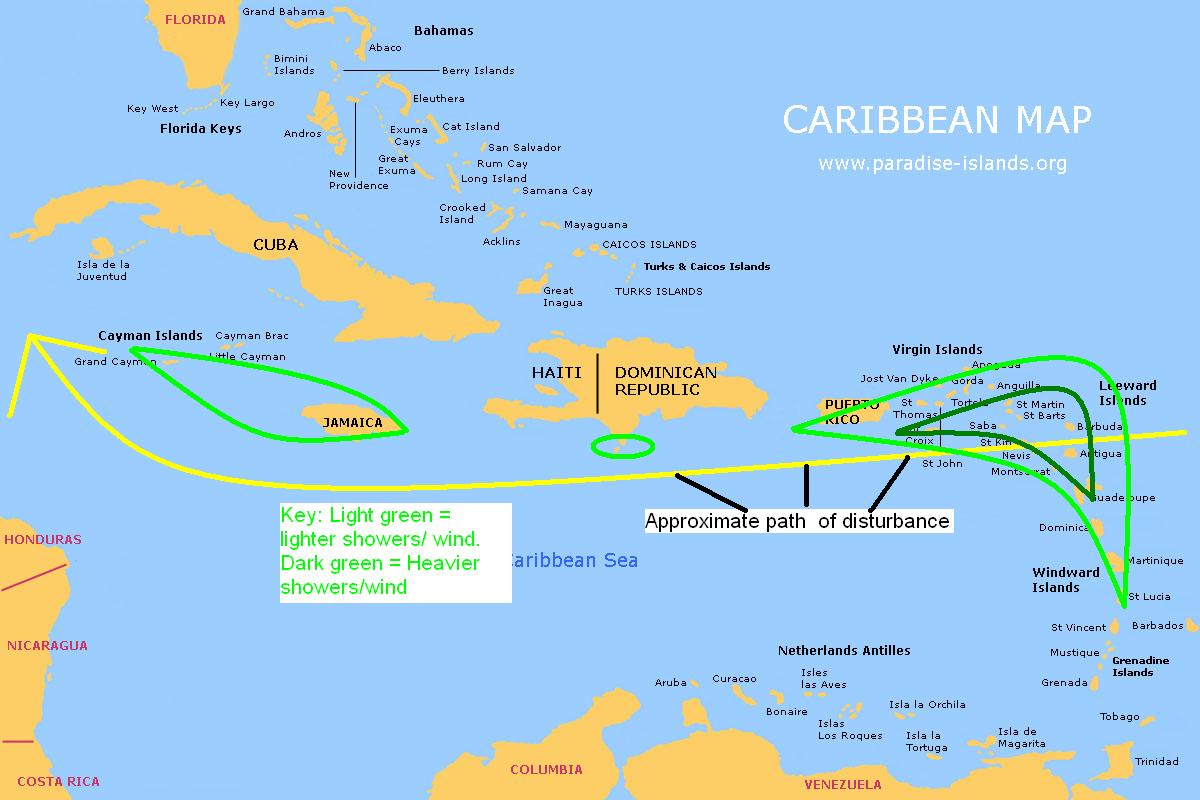
This is where I expect the storm to track through the next few days. However, uncertainties still abound and this map will likely change significantly in tomorrows update. The Northern Windward’s and Leewards should expect heavy rains and high winds from this disturbance.

There is much less to talk about in terms of the Eastern Atlantic disturbance 96L.

96L

This is the early evening satellite image of 96L. I’ve marked the APPROXIMATE center in the black circle and the heaviest thunderstorms inside the red lines. This system is lacking any healthy upper level air pattern and that will be one of its top priorities if it wants to develop into a TD.

96L2

This graphic shows the satellite imagery on the top and the microwave imagery on the bottom. On the bottom, I’ve highlighted the heaviest thunderstorms in black and the center in red. as you can see, it’s a lopsided storm with all the convection to the western side. this is caused by strong upper level winds out of the east. The track and intensity model side is down as I write this do I will not be able to display those graphics at the moment but hopefully it will be back online tomorrow. The forecast from the other models look the same as yesterday, out to sea (OTS) as an open wave. This is the forecast I will stick by as well.

96L3

This map show the shear (highest=red, decreasing to black, the lowest) I highlighted 96L in the red circle and its expected track shown as the red arrow. Also highlighted is the problematic area of high shear outlined in black.

In the tropics elsewhere, we have a tropical storm in the eastern Pacific named Kiko. This storm has top winds of 60 mph. Other information from the NHC is listed below.

2:00 PM PDT Sat Aug 31
Location: 19.3°N 116.2°W
Moving: NNW at 5 mph
Min pressure: 1000 mb
Max sustained: 60 mph

This is the data from the NHC on TS Kiko.

KIKO

This shows Koko’s position in the Eastern Pacific as well as the satellite imagery.  As you can see, shear is also a problem for Kiko as most of its convection is located to the east of the center.

KIKO1

This map shows the satellite imagery on top and the microwave imagery on the bottom. Notice on this microwave imagery, there is a substantial amount of strong thunderstorms signaling a stronger system. Also notice it’s problem with shear- all the convection is pushed to the east signaling strong winds out of the west.

In other weather news…

Invest 96L kills 55 people in Mali from heavy rains. Link
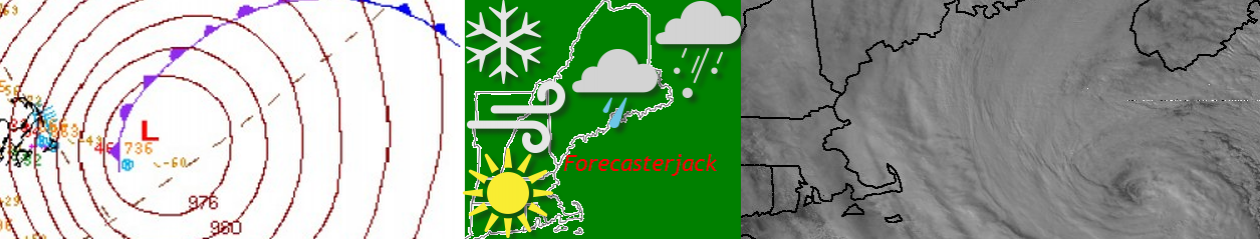
A cold front moving across the eastern US promises a rainy Labor day for the East Coast. Showers/ thunderstorms are possible across the eastern 1/3 of the country Sunday but the real action kicks off Monday with widespread rain and embedded thunderstorms.
Tropical depression Kong-Rey drenched Taiwan causing widespread flooding. Link

I’ll publish another update tomorrow.

-Jack

Disturbances in Atlantic are slowly organizing

There are 2 disturbances in the  tropical Atlantic ocean which have potential to  develop into tropical cyclones. One is located about 700 miles east of the Lesser Antilles and the other over the farthest western reaches of Africa. Lets start with the one that is closer to home.

TWO 8-30-13


This map highlights the NHC‘s OFFICIAL forecast for development. The yellow circle is our first AOI. They gave the wave a 10% chance of development in the next 2 days and a 20% chance in the next 5 days. The orange circle is our 2nd AOI. They give it a 40% chance of development in the next 2 days and a 60% chance of development in the next 5 days.

There is a tropical wave located about 700 miles east of the Lesser Antilles. This wave is moving westward at around 10 mph.

sat3


This shows our first AOI to look at.  The wave will continue to move westward through the Caribbean. When it reaches the Western Caribbean, there is the chance a trough in the upper atmosphere could tug it to the north however, those details are still shady.

GFS1


This is the GFS ensemble upper air map for Saturday. I’ve marked the position of troughs capable of tugging our disturbance northward. Read more about GFS ensembles and this upper air map. The effects of the trough, however will only be felt if the storm sticks up high enough to get caught by the trough. An equally likely scenario (or probably more likely) is that it stays west, crosses Central America, and enters the Eastern Pacific where it could become a tropical cyclone.


shear2


This map shows the main problem for this disturbance-wind shear. This will rip up the thunderstorms which destroys a tropical cyclone. The area of high wind shear is marked with the red line.

The forecast for this disturbance is for little development. I’ll highlight what some of the models think plus my thoughts below.

GFS-Open wave moving west into Central America
NAVGEM-open wave moving NW then re-curving to the NE over open waters.
CMC-The outlier. Has a strong TS/Weak hurricane following a track like Irene through the Bahamas. I doubt this will happen, however it is still a possibility.
My thoughts- I like the GFS’ idea of an open wave tracking over the eastern Caribbean however, I think instead of going into the Eastern Pacific, I think it will track through the Caribbean and over the Yucatan like several other waves have done this season in similar conditions.

CaribbeanMapLarge


This map shows the track I expect it to take along with the impacts I expect it to have on some of the Islands. Areas outlined in light green indicate lighter rain/wind while areas outlined in darker shades of green indicate higher winds and heavier rain. I do not expect any major impacts to be felt anywhere.

Now to our second disturbance. This one shifted its center slightly east over the farthest western tip of Africa. This wave will move NW into the open waters of the North Atlantic. The models don’t really want to do much with it all developing a weak TD or TS at very best.

shear 4

This map shows our AOI and the area of high wind shear it will head into suppressing development. This is the reason that there is little model support for its development.

In other news… There is a strong extra tropical low off the Canadian Maritimes that will give them some rain and wind.

Tropical Depression Kong-Rey in the Western Pacific will bring rain and wind to Japan before swiftly exiting the picture there.

My next post will likely be tomorrow or Sunday.

-Jack


Complete tropical update

As we approach the peak of hurricane season, the Madden Julian oscillation is arriving over the Atlantic.

MJO
This Graphic highlights the GFS ensemble forecast for the MJO. Image credit Noaa/NWS.

This will bring increase rising air and instability which encourages thunderstorm growth. This will enhance convection-a necessary ingredient for tropical waves to develop into cyclones. No matter how much of a circulation a storm has, it will not be designated by the NHC until sufficient Convection, or heavy thunderstorms are present.

We now have a few areas to watch.

TWO 8-29-13

The red arrows indicate strong upper level winds/wind shear that can disrupt development. Wind shear disrupts development by pushing the storms thunderstorms to one side of the circulation.

shear1

This map shows exactly where the upper winds are and aren’t. I’ve highlighted the area of harsh upper winds that could impact our disturbances in the near future. Note: this map shows the Atlantic basin only to 35W and only 1 of our disturbances. Image credit CIMSS/SSEC.

The disturbance closer to the Antilles Islands is the first one to watch. It will move westward in no particular hurry over the next few days and encounter harsh upper level winds in the next 2-3 days while in the eastern Caribbean. After that, it will enter the western Caribbean where more favorable conditions await. Below I will describe what some of the models think of the storm.

GFS-Keeps it as an open wave while it moves through the Caribbean.
NAVGEM-Generates a weak TS over the NE Antilles between hour 96 and 108 while moving NNW out to sea.
CMC-Generates strong TS around hour 72 moving on same track as NAVGEM

My forecast is for an open wave like the GFS suggests as it is the most credible of the 3 models listed here. Also, storms this season as well as last season have really struggled to make it through the eastern Caribbean. A TD or weak storm is possible one the wave gets into the Gulf of Mexico (GOM).

sat1

This graphic highlights my thoughts on this disturbance (Yellow circle) and its track. It also highlights the principal reason for not developing- an area of dry air and high shear to its north that is slowly sinking southward.

This disturbance is the one most likely to affect land bringing squally weather and occasionally gusty winds to parts of the Antilles in the next few days.

CaribbeanMapLarge (1)


Map showing impacts on the Windward and Leeward Islands as well as impacts on the other Caribbean islands.

The second disturbance, just off Africa, has a much greater chance to develop. It will move NW into an area of harsh upper level winds. Despite this, model confidence is low with only the GFS generating a very weak TS or TD.

GFS- Weak TS with genesis occurring around hour 120 heading NNW out to sea (OTS)
NAVGEM- Open wave moving WNW
CMC- Open wave moving W

AT_Track_chart_update_1.pdf


This graphic shows our second disturbance, my idea of track and where it will run into unfavorable conditions. I expect very little development with a TD at best. The reason being that by the time conditions in the upper air relax, the storm will likely be over cooler waters in the North Atlantic accelerating to the NNE. This storm could turn into a mid latitude low and help fuel an extra tropical cyclone that could impact Europe or Iceland or both.

Elsewhere in weather…

sat2


There will be a low developing over the Great lakes that will drag a cold front across the eastern US come Sunday/Monday. This feature will bring showers,  and thunderstorms over Labor day weekend as well as some cooler air for the first week of school in many places.

Tropical storm Kong-Rey in the Western Pacific will hit Japan in the next 24 hours and swiftly move across the country into the northern Pacific. It will transition into a powerful extra tropical cyclone in the Bearing straits before impacting Alaska.

My next post will be in the next day or 2 or if one of our 2 disturbances develops further.

-Jack

Tropics heating up…

After an inactive start to the season, we are about to turn over a new page in the tropics. The main driver will be the Madden-Julian Oscillation, a pattern of shifting winds that increases thunderstorm growth that returns to the same area every 30-60 days. This pattern will make itself known later this week into this weekend and will continue through mid September. For those of you who follow tropical weather, we saw this pattern in the Central Pacific and the Eastern Pacific these past few weeks which was why there was so much activity there. (2 storms in a week in the Central Pacific is VERY active) We already have a few interesting African Waves to look at…

IR1

Our 2 African waves that need to be watched. More are expected to arrive from Eastern Africa over the course of the next few weeks.

Another unusual thing about this particular MJO pulse if there have only been 2 of this extreme caliber in recent memory. In those 2 cases, 68% or 21 out of 31 depressions formed into hurricanes. The models are already excited showing nearly every wave evolving into a system. Most of which will recurve due to a high pressure system that usually steers it into the Caribbean being too weak to have the westward effect on storms.

ta111

The position of the Bermuda high is further westward and weaker allowing strong storms to recurve easily out to sea.

However, if a storm is weak enough it will continue westward into the Caribbean where so called “rocket fuel” is located allowing for rapid intensification under the right circumstances.

ta1111

This map depicts a possible track for a weak storm that can continue westward despite the position of the high.

TCHP1

This map shows where the most possible energy is for a tropical system to feed on.

I believe the last time a storm traversed this area was in 2008, 5 years ago when Gustav moved from the Western Caribbean into Cuba. This is also the same area where Wilma intensified into a monster 882 mb, 180 mph, cat 5 hurricane. The other danger that lies here is that any storm that forms and intensifies WILL affect land and has a 95% chance of making landfall somewhere. The good news is that no model currently forecasts a storm to develop here however its an important area to watch nonetheless.

A further update on the tropics can be expected in a few days or when a system develops or is a threat to develop.

-Jack