Hello everyone!
It is not customary for me to send out an update in the afternoon, but since I had a few minutes, I wanted to give those interested a look into my forecast verification process. Perhaps you don’t need me to remind you that I made a few mistakes with the forecast for our snowstorm yesterday. Much of the area didn’t see as much snow as was forecast. An important part of becoming a better forecaster is identifying and learning from errors like this so hopefully they don’t get repeated in subsequent forecasts. With that in mind, let’s take a little trip back to see what happened yesterday and what clues to look for ahead of time when our next nor’easter appears on the horizon.

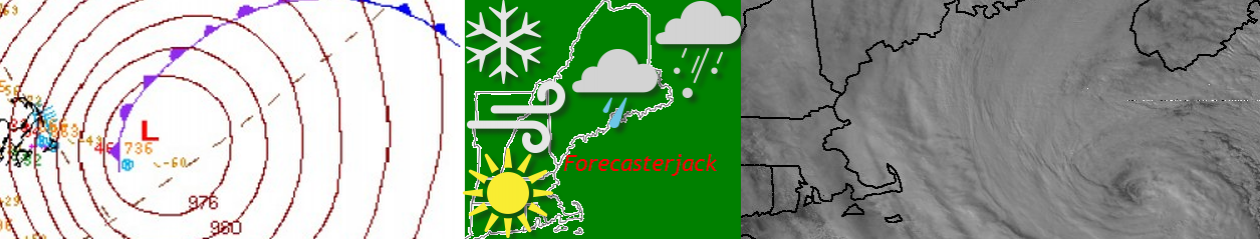
The large-scale forecast actually wasn’t so bad. We got our big nor’easter as the two jet stream disturbances joined forces. The storm rapidly intensified, just about exactly as much as was predicted. The storm’s track forecast was also pretty much on the money as the surface low raced from the Delmarva to Cape Cod and eventually over towards Eastport Maine. Yet as is often the case, the devil is in the details and the smaller-scale processes embedded within our storm proved quite fickle.

We’ll start with an overview of how much snow fell compared to how much was forecast during my morning updates on 12/4 and 12/5. At first glance, the broad contours of the forecast don’t look so bad. The lowest amounts were found near the coast and especially along the Midcoast. Lower totals were also found and expected along the CT River over in western NH. The jackpot was up in the Whites and the mountains of western Maine, though the analysis data I used to produce the observed plot seems to be leaving out some of the 15-18″ reports from Rangely and Carrabassett Valley. Once you look a little harder though, it’s clear that for most, I was about one category too high. Most inland areas expected to get 8-12″ actually picked up 4-8″ for example. Then there were two spots where things got really ugly: Central NH south of the White Mountains (expected 12-18″, got 0-2″) and the Midcoast just north of Route 1 (expected 4-8″ or 8-12″, got around 2-4″).
So what went wrong?

This cross-section, taken from a model forecast issued Friday morning, provides some clues. This cross-section intersects both of the areas that busted hardest. With the benefit of hindsight, it’s clear that the model was flashing some warning signs that went unheeded. Strong downsloping (positive omega values = downward motion) south of the Whites led to warming and drying of the air there. With temperatures already near freezing at the surface, it didn’t take much of a topographical influence to make snowfall accumulation near impossible here. While we don’t often see such a dramatic topographically-induced snowhole, it’s clear that extra attention needs to be paid to the mountains when the environment is so marginal for snow to begin with.
Farther east over the Midcoast, a layer of warm air (above freezing) aloft is noted from around 900mb (~1500ft) to around 850mb (~5,000ft). This is a separate layer from the warmth right at the surface which only extends a couple hundred feet up. While winds near the surface were quite strong from the north, winds in that layer a couple thousand feet up had a strong easterly component. That means warm air was moving in from the Atlantic rather than cold air from Canada.

Running a backwards trajectory plot using old model data confirms this intuition. Air parcels 3,000 feet above the ground over Bath last evening started out over the Gulf Stream a couple days ago. While they cooled on approach to the Maine Coast, it just wasn’t enough to keep that part of the area all snow.
When looking at forecast model data ahead of the storm, I was wondering why guidance seemed to be pushing the rain/snow line inland during the 5-8 PM timeframe when winds near the surface were increasing from the north, the sun was setting, and intense lifting would surely favor dynamic cooling of the thin near-surface warm layer. The answer it seems was that during this time, there was a surge of warm air aloft that developed in response to the same jet stream dynamics supporting our heavy precipitation. While dynamic cooling can easily blast through shallow warm air near the surface, especially with winds from the north, it’s a lot harder to offset a thick layer of warm air aloft that’s being reinforced by a steady east/southeast wind.
We can see hints of this in the weather balloon data gathered at 7 PM yesterday by our friends up at the NWS office in Gray.

The layer of warm air a couple thousand feet up appears clearly on this sounding, even though Gray was west of the rain/snow line. If the balloon were launched from Brunswick or Bath, it surely would show a layer of above-freezing air here.
The sounding is also interesting because it sheds some light on why the rest of the area, on the correctly-predicted side of the rain/snow line and away from any discernable downsloping, didn’t see quite as much snow as we expected. The classic six-sided snowflakes that accumulate most efficiently form between temperatures of -12 and -18 Celsius. To get lots of these snowflakes, we want the layer in which they form to be deep, moist, and stocked with strong upward motion. Otherwise, we’ll end up with plates or needles that don’t stack up nearly as well. On the GYX sounding from last night, we can see the -12 to -18C layer is really high (around 15-18,000ft) which is well above the layer where we were seeing the best upward motion (estimated around 10,000ft). So we weren’t getting the best snowflakes to begin with. Then, as those snowflakes fell, they were warmed to near freezing by that layer discussed above. While this didn’t melt the flakes, it did prime them to melt more easily when they came in contact with warm surfaces. So unless it was snowing really hard, we weren’t getting much accumulation.

This was actually depicted pretty well by model guidance ahead of time. The sounding shown here, off the Friday morning NAM run, shows pretty much exactly what happened in the Gray area. Dendritic Growth Zone (DGZ) was high/thin and there was a nose of near-freezing air near 800mb (~6,000ft). I actually looked at several soundings like this before the storm but decided to mentally cool things down a bit to adjust for a known bias in the NAM to generally be too warm in situations like this (due to some issues with how it handles thunderstorms).
As it turned out, this was actually a good move!

If you look carefully at the NAM forecast for this time, it shows rain all the way up past Augusta/Waterville and over to Windham, all locations that were experiencing snow at the time. So betting on the NAM to be too warm was the right call, I just overdid the correction.
At the end of the day, hindsight is 20/20 and what’s obvious now was a lot less obvious before the outcome was known. As with any storm, particularly one where my forecast wasn’t so great, the lessons learned will help improve the forecast for our next nor’easter, whenever it may come. I’ll be watching extra closely for localized downsloping and I’ll run a few trajectory analyses ahead of time to see if there might be any sneaky warm layers. I adjusted snow:liquid ratios down quite a bit from the standard 10:1 in light of our warm surface temps, but I’ll be adjusting downward even more if we have poor snow growth and that layer of near-freezing air aloft to prime the snowflakes for melting on contact with the ground.
Thanks to all those who still follow along despite the missed forecasts here and there along the way.
-Jack

Thanks, Jack. I learn so much meteorology from your forecasts and postmortems. Keep up the good work!
Thanks so much Doug!