Hello everyone!
In any field that requires making predictions such as meteorology, post-prediction verification and reflection is a key part of the job. I won’t ever be able to claim that I have a perfect forecast, but I owe it to all those who trust my forecasts to learn from the mistakes I inevitably make so that I don’t get tripped up again. That process of learning from busted predictions is why the weather forecasts you get from me or from elsewhere are so accurate despite the immense challenges associated with predicting the future state of the atmosphere.
With that in mind, as you might recall a few days ago we had a storm that I did an exceptionally bad job predicting. I expected 2-4″ to fall over the course of the day on Monday (December 30th) and some places reported over 8″. More snow fell on Tuesday which bumped storm totals well into the double digits not only in parts of the mountains where that was expected, but also in parts of York and Cumberland counties. Given that the nuances of mesoscale banding such as that which occurred on Tuesday are always hard if not impossible to pin down in advance, I feel pretty good about what happened during the second part of the storm’s evolution. Therefore this retrospective look will focus mostly on Monday.

I prepared Monday’s forecast fairly early in the morning, as per usual. I analyzed radar imagery, current observations, and forecast model guidance. Having spent a considerable amount of time over the weekend analyzing the storm for weather.us, I had a fairly solid mental model of what I anticipated would happen before I even opened my computer. All I needed to do was tweak my previous expectations to account for newly available information and summarize it for you all to read.
My expectation was that a batch of precipitation associated with the warm front of a storm over the Great Lakes would approach the region from the southwest during the morning hours. As it moved northeast into Maine, it would lose momentum due to a combination of low level dry air surging southwest from strong high pressure in Canada, and a loss of mid-level upward motion as the Great Lakes storm weakened and moved westward away from our area.

As a result, I was expecting light snowfall accumulations around or below 2″ over SW ME and moderate snowfall accumulations between 2-4″ over NH (closer to the storm, and thus the upward motion needed for precipitation). I expected little to no snow across northeastern parts of the area due to the presence of very dry air in the lower atmosphere which would evaporate snowflakes before they could make it to the ground. Strong upward motion could have offset the effect of the dry air, but the fact that the storm was weakening and moving away from ME/NH supported forecast model guidance which suggested that the best upward motion would remain to our south.
Helpfully, forecast model precipitation guidance such as the ECMWF shown above was in agreement with my conceptual model based on a general understanding of the large-scale pattern. I actually thought the ECMWF was a bit too bullish on its forecast for precipitation given that it was overpredicting dew points in the airmass to our northeast (the air moving in from Canada was drier than the model thought) but I didn’t adjust my forecast too much in that direction.

When I analyzed radar imagery, my conceptual model and the forecasts offered by model guidance seemed to be on track. A wide area of light to moderate snow was gradually receding as dry air surged southwest. The snow was perhaps a bit more widespread and intense than I would’ve thought initially, but the apparent error wasn’t all that noticeable except for folks in/near Lewiston who would wake up with a dusting of snow when I thought they would only see flurries at best.
Looking outside in Yarmouth, I saw about 2″ of snow which was towards the high end of what I thought might happen, but given that the dry air seemed to be approaching quickly, I didn’t give it too much thought. One tricky aspect of preparing a forecast early in the morning is that few people have stepped outside with their rulers by that point in the day. While radar imagery is helpful, it doesn’t tell me how much snow has actually fallen. The automated weather stations located at airports across the area are very helpful too, but most of them don’t report snowfall totals until 12z (7 AM) which is after I sent my forecast. Perhaps if I had known there was already 4″+ on the ground in parts of central NH and interior SW ME, I could’ve adjusted my forecast to be a bit closer to what actually happened.
With forecast model guidance and my mental model in good agreement both with each other and with the observations I was analyzing, I went ahead and typed up my forecast with fairly high confidence. In hindsight, that confidence was misplaced.
The key error I made on Monday was putting too much trust in the ability of forecast models to accurately predict the upward motion needed to generate precipitation. Instead of analyzing the wind and temperature fields and using my knowledge about what physical processes can produce upward motion in the atmosphere, I trusted the models to do that work for me.
Because the volume of data available to forecasters is so enormous, there will always be a need to place some amount of trust in the models. The human brain just can’t process that much information in a reasonable amount of time. One of the skills that’s becoming more important as our world becomes oversaturated with data is sorting the signal from the noise. When can we accept what’s given to us (by models) verbatim and when do we need to dig into the weeds and figure things out for ourselves? This problem isn’t unique to meteorology.
The map below is a bit noisy but to the eye of someone who has spent far too much time digging into forecast model guidance, it should scream heavy snow across central NH/SW Maine. Winds and temperatures at 700mb (about 10,000 feet) are plotted along with relative humidity at 700mb (thin contours) and 850mb or ~5,000 feet (shading). The model’s forecast for upward motion is also plotted in orange contours.
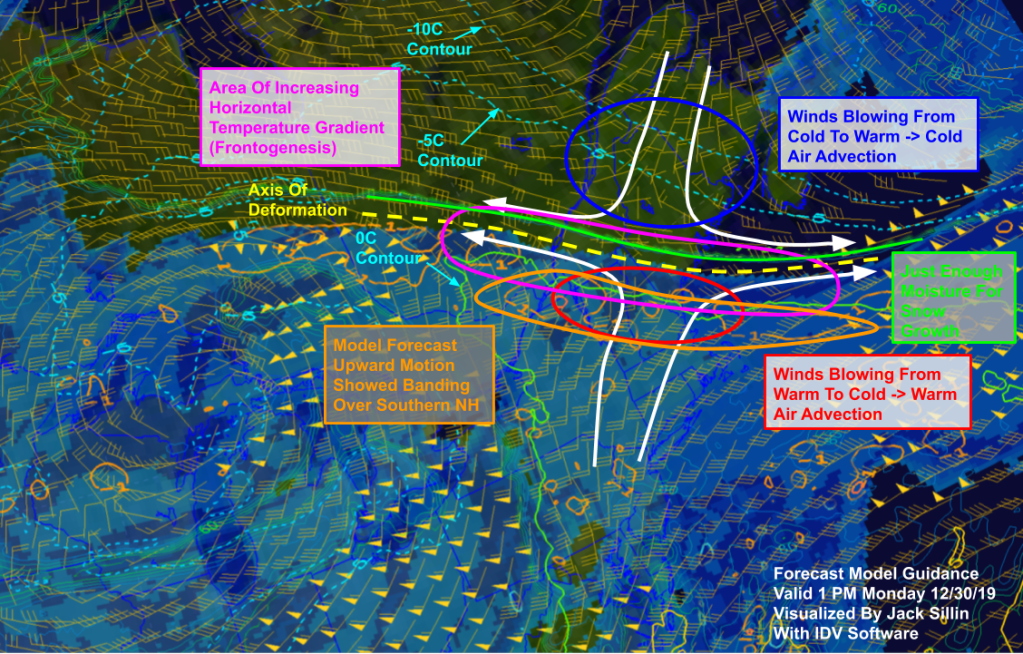
If we focus on the 700mb winds and temperatures for a minute, we can see that Maine is at the center of something called a “deformation zone”. This happens when winds blowing from opposite directions run into each other. In our case, northeasterly winds moving in from Quebec are crashing into southwesterly winds advancing from the Mid Atlantic. Deformation zones are often focal points for heavy banded precipitation because when two airmasses crash into each other, upward motion develops via a process known as frontogenesis. For a more in-depth look at frontogenesis and why it leads to upward motion, check out my article for weather.us which digs into that process.

Sure enough, objective analysis products valid 1 PM on Monday show a narrow zone of frontogenesis producing heavy snow located just south of the deformation axis. This is consistent with the forecast model guidance analyzed above, and would also be consistent with the large scale setup visible on satellite imagery. A close look at the fundamentals (wind/temperature/moisture) in the mid levels would have made it pretty clear that heavy banded snow would continue through most of the day on Monday across central NH and SW Maine. Unfortunately, I figured that the model’s prediction of strong upward motion over MA/SW NH was reasonable and kept heavy snow out of the forecast.
In short, the forecast bust on Monday resulted from a model error that I failed to catch because I didn’t think to double check the relevant part of the model’s analysis. In retrospect, this seems pretty obvious but without the answer key, it’s very difficult to figure out where model guidance is doing a good job and where it might miss a key feature or two.
Given that I don’t have the capacity to double check every aspect of the model’s work, choices must be made about what information to accept verbatim and what to analyze more closely. I think the biggest lesson I’ll carry away from this storm is that paying closer attention to the fundamentals (wind/temperature/moisture) instead of derived parameters (such as upward motion) is valuable, especially in tricky setups like this. In situations where the fundamentals are telling a different story than the derived parameters, I should be better about trusting my knowledge of the fundamentals rather than leaning on the model-derived parameters.
I would like to apologize again for any inconveniences caused by the forecast error on Monday. I would also like to say thanks for the understanding so many of you have expressed in the past few days. Most meteorologists have inboxes and comment sections full of hate mail after a busted forecast. I have yet to receive a single negative message about the recent storm. Given the state of the internet as we enter 2020, I think that’s pretty cool.
-Jack
